By now, almost everyone knows the news about the 2021 Intergovernmental Panel on Climate Change (IPCC) report, published last week.
This is a research carried out by 234 scientists (28% women) from 65 countries who have evaluated more than 14,000 thousand research projects on Climate Change.
And the inferences of this meticulous study leave no doubt that we are responsible for the increase in the warming of the atmosphere, oceans and land. What’s more, recent changes in the climate are widespread, rapid, and increasingly intense; unprecedented in thousands of years.
The truth is that the data is quite alarming. The negative effects that affect us due to the mismanagement of resources since the Industrial Revolution, and – worst of all is that, despite knowing the damage we were causing, we have continued with the same strategies.
For example, concentrations have continued increasing, reaching an annual average of 410 ppm CO2; 1866 ppb of methane (CH4) and 223 ppb of nitrate oxide (N2O)[1].
The CO2 concentration is the highest in the last 2 million years, as well as the methane and nitrous oxide values that show atypical values in the last 800 thousand years. Sea level rise is evident, with a faster rate in at least 3,000 years; and a decrease in sea ice in the lower Arctic in the last 1000 years where other changes can be seen such as a 40% decrease since 1979.
The document also shows how during the last decades, warming has been growing progressively. To give us an idea, the period 2001 – 2020 the increase was 0.99 ºC compared to the period 1850 – 1900.
Other phenomena that have undergone unprecedented changes are the increase in extreme heat, heavy rains, periods of drought (especially in the African continent and in the Mediterranean basin), wildfires, and the state of the oceans (warming, changes in acidification, oxygen reduction and loss of biodiversity); all of them more frequent and more extreme.
And the case we must consider is that future emissions would cause additional warming; in other words, the impacts would be more serious. For example, extreme rainfall events intensify by approximately 7% for each additional degree of global warming.
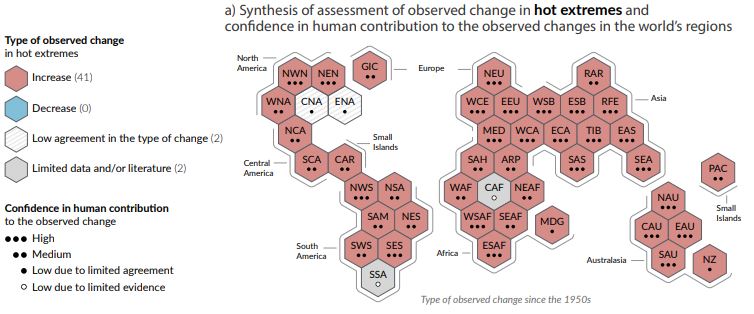
And – indeed – it is global, because climate change is affecting all regions of the planet. As shown in figure 1– where the regions of the Earth are represented with 45 hexagons, – with respect to the hot extreme values (days with more heat in 1 year since 1950) we note that there is no region where values are shown negative (light blue), but 41 regions with increased hot extremes.
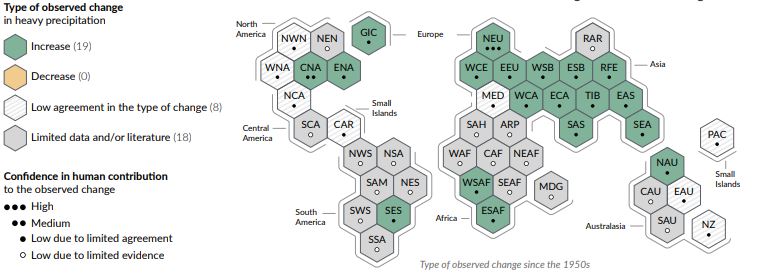
Figure 2 shows the extremes of daily precipitation (since 1950), it shows that 19 of 45 regions show an extreme of heavy precipitation (Green) and none of them show a decrease (Beige). However, areas are shown in which these changes are not very clear (Gray) due to not having a consistent tenure or significant statistical data have not been found to assess it objectively.
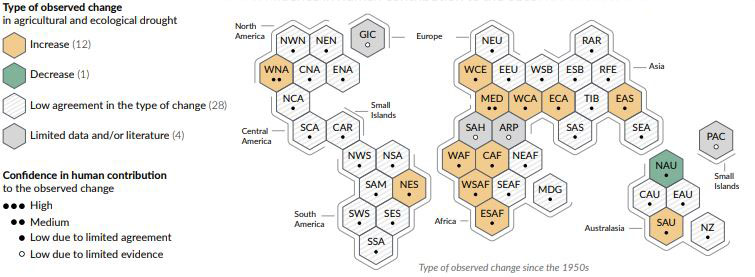
Figure 3 shows the distribution of agricultural and ecological droughts (where soil moisture has been below normal), showing the 12 regions with increased drought in which the Mediterranean region, West Africa and Northeast South America are located.
[1] Year 2019 data